Latest News
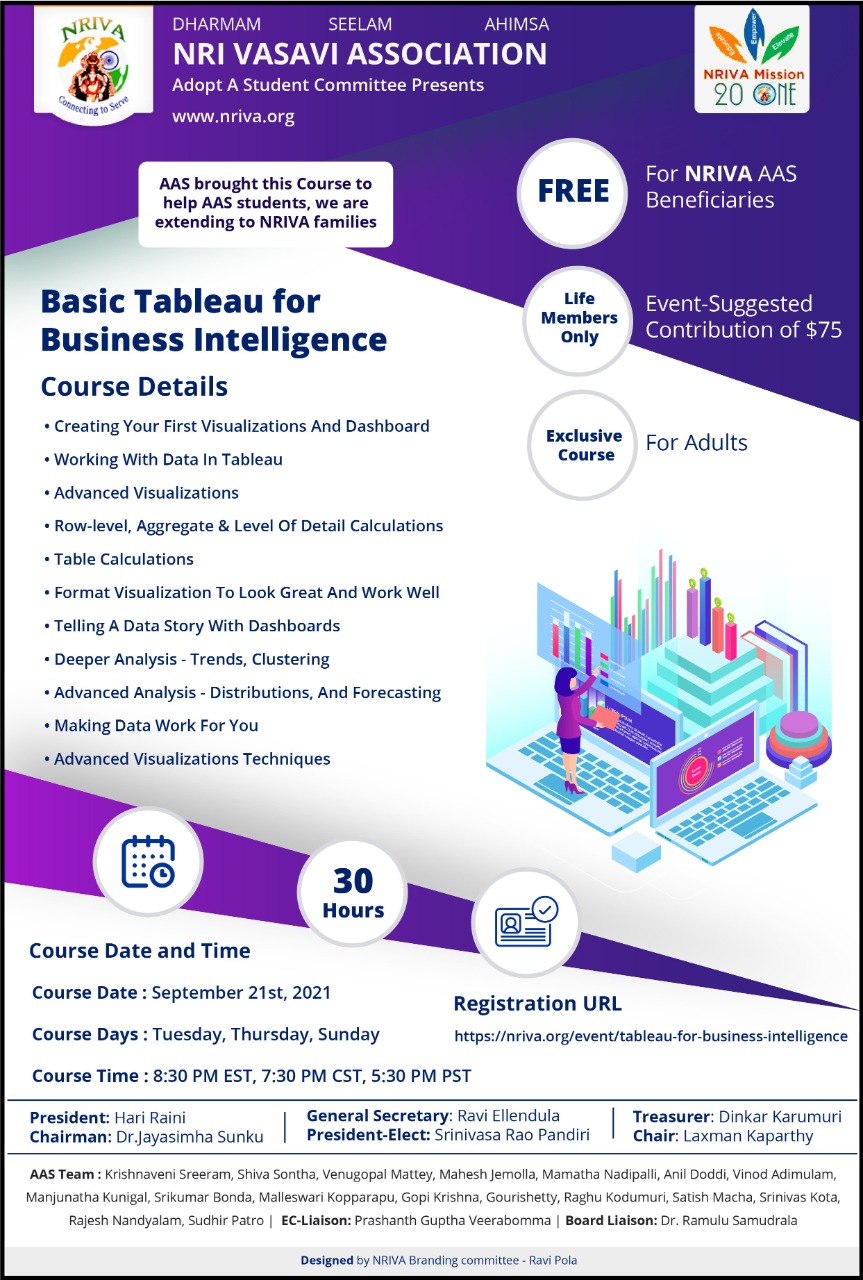
Tableau for Business Intelligence
Dear Vasavites
Start Date: September 21st, 2021
End Date: November 4th, 2021 (Approximately)
Days: Tuesday, Thursday & Sunday
Time: 8:30 PM EDT to 10:00 PM EDT
Number of Sessions: 20
Instructor: Dr. Suresh. He taught AI/ML and Data Science class before for NRIVA.
Course Description: Learn how to create effective data visualizations with Tableau and unlock a smarter approach to business analytics. Tableau has for some time been one of the most popular Business Intelligence and data visualization tools available. Why? Because, it’s a tool that’s responsive to the needs of modern businesses. But it’s most effective when you know how to get what you want from it – it will make your business intelligent. Beginning with the fundamentals, such as data preparation, participants will soon learn how to build and customize your own data visualizations and dashboards, essential for high-level visibility and effective data storytelling. Participants will also find out how to do trend analysis and forecasting using clustering and distribution models to inform your analytics.